Though formal and empirical research has established the importance of large protests, their dynamics remain less understood. Empirical investigations have generated contradictory results for decades, making repression and protest dynamics an enduring puzzle. Studying these dynamics has been difficult because existing methodologies generate coarse (ordinal) estimates of violence and have difficulty measuring the size of protests, possibly contributing to the literature’s conflicting results. That is, violence is rarely coded as having more than 2 or 3 values, and there is no universal mapping of violence to these values across datasets. Protest size is often ignored and protests are coded as occurring or not; given well-known threshold biases in media sources that traditionally form the basis of protest studies, these studies have difficulty distinguishing between small, medium, and large protests. Given the measurement difficulties facing earlier work, it is perhaps not surprising that results contradict each other.
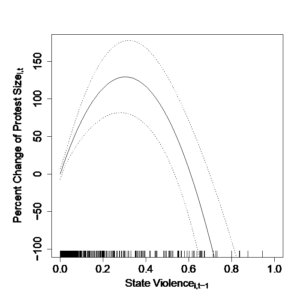
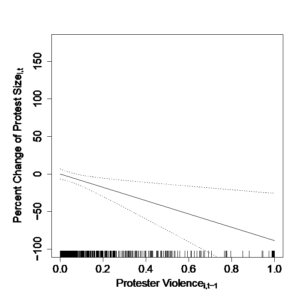
Our article argues and shows that how violence affects protest dynamics depends on its source and severity. When it comes from the state, low amounts of violence mobilize more protesters while high amounts demobilize them, creating an n-shaped relationship between state violence and subsequent protest size. Lower than expected costs to protest and emotional backlash generate the increase in protest size, while higher than expected costs and dispiriting emotions shrink it. Protester violence always leads to smaller protests because it decreases the appeal of protesting and increases the probability of state violence. This core result is shown in the below figure, which is Figure 3 in the article.
Figure: Low levels of state violence against protesters correlate with larger subsequent protests, but high levels correlate with smaller ones. Protester violence always correlates with smaller subsequent.
Our paper can make this advance thanks to a measurement innovation: computer vision applied to millions of geolocated tweets containing images. A convolutional neural network (CNN) is developed to recognize protest images. Of 42.6 million tweets from protest waves across five countries, 4.6 million contain an image. Approximately 115,000 of these images likely contain a protest. A second CNN generates binary and continuous measures of state and protester violence; these classifiers outperform Google Vision, a third-party CNN. This scene classifier is complemented with a third CNN, a face classifier. This classifier estimates the gender and age of each face, allowing us to control for well-known correlations between these demographic features and protest participation. Summing faces in protest images generates estimates of protest size, and extensive corroboration shows that these estimates are consistent with actual protest size. This pipeline generates daily estimates of the size of the protest, the severity of state and protester violence continuously valued from [0,1], and potential confounds for twenty-four cities in Hong Kong, Pakistan, South Korea, Spain, and Venezuela.
Synthesizing this paper’s results with others’ suggests protest dynamics work as follows. Preventative repression, such as arresting a group’s leaders or seizing their offices, makes it harder for protests to start. Once started, protester violence decreases support for protest and therefore its subsequent size. Repression produces differential effects depending on its severity: light state violence generates backlash while severe state violence “works”.
Two other features of the paper are notable. First, we show that using social media recovers many more events than using mass media. Since mass media also generates coarse measurements that probably cause puzzling results in the literature, researchers should move towards using social media to measure protests. Second, we consistently refer to the “n-shaped” relationship of state violence and protest size. This is in contrast to the “inverse-u” that is the predominant method for describing curvilinear relationships. Since n is an actual letter that requires no extra mental power to understand, we hope others follow us in describing relationships this way. And please do not call the opposite relationship an inverse-n!
If a picture is worth 1,000 words, then it would require approximately two kilobytes of storage. Images from consumer cell phones and digital cameras, however, require at least three megabytes of storage, usually more. Even images shared on social media platforms, which are compressed from their original size, require hundreds of kilobytes of space. A picture, in other words, is worth anywhere from 50,000 (100 kilobytes) to 1,500,000 words (3 megabytes). A picture is actually worth a book, and vast libraries beg for exploration.
About the Authors
 Zachary Steinert-Threlkeld- The University of California, Los Angeles
Zachary Steinert-Threlkeld is an Assistant Professor of Public Policy at UCLA. His research focuses on protest dynamics using computational techniques and network analysis. You can find further information regarding his research here and follow him on Twitter: @ZacharyST
 Alexander Chan- Meta
Alexander Chan is a Research Data Scientist at Meta (Facebook). You can reach his LinkedIn profile: https://www.linkedin.com/in/alexandermchan/.

Jungseock Joo- The University of California, Los Angeles
Jungseock Joo is an Assistant Professor in Communication and Statistics at UCLA. His research focuses on human-AI interaction, computational social science, and explainable and fair computer vision and deep learning. You can find further information regarding his research here and follow him on Twitter: @jsjoo3.