
Making research findings accessible
“[S]tudents, public officials, and scholars should not need to understand phrases like “coefficient,” “statistically significant,” and “the 0.05 level” to learn from the research” (King, Tomz and Wittenberg, 2000, 348). In other words, research findings should be accessible to wider audiences who do not necessarily have a technical background. Many political scientists have adopted this approach, improving the empirical practice on presenting and interpreting results. Indeed, the norm today is to compute substantive quantities of interest rather than discussing regression coefficients.
For example, to demonstrate that there is a gender gap in terms of promotion outcomes, the analyst would separately compute the probability of promotion for men and women (using the coefficient estimates from a previously fitted statistical model). If the probability of being promoted is higher for men (after controlling for formal qualifications and productivity levels), this would confirm the gender bias expectation. Unlike references to regression coefficients, most people should understand the results presented this way. Yet there is an additional complication. Research results always entail a degree of uncertainty, which we must also take into account. To indicate how uncertain they are about the estimated quantity of interest, analysts typically report a plausible range for the estimated effect via the confidence interval (CI). Being upfront about the uncertainty of our estimates is necessary. Employing the standard CI for this task, however, is problematic when the goal is to compare estimates.
The problem
When comparing two quantities of interest the use of the standard CI can be misleading and may lead to incorrect inferences. The problem is that when two CIs overlap, the associated estimates may or may not be statistically different (Schenker and Gentleman, 2001). Simply put, on its own, the CI does not provide the information necessary to ascertain whether the compared estimates are, in fact, distinct. Seasoned researchers know better than to equate overlapping CIs with an insignificant difference. But what about less technical readers such as students, practitioners, or policy makers? The answer is likely no. In practice, the CI overlap “leads many to draw such [wrong] conclusions, despite the best efforts of statisticians” (Wright, Klein and Wieczorek, 2019, 165).
To illustrate the problem, let us consider two analyses from Grossman et al. (2016) about the effect of ethnicity-based court composition on judicial outcomes in Israel. Figure 1a and 1b reproduce the study’s incarceration rate and prison term results. Importantly, this replication is for illustration purposes only. In particular, here I discuss just a subset of the many empirical tests conducted in that study.
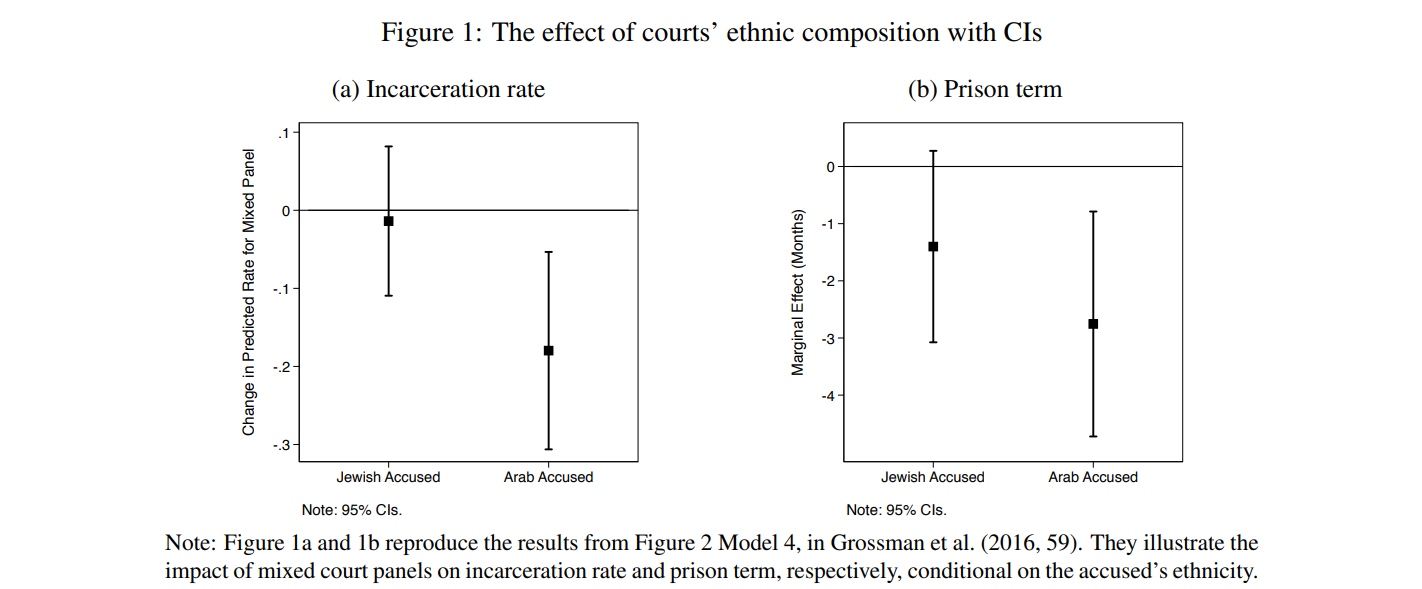
Simplifying the argument, the main theoretical expectation is that the effect of mixed court panels is conditional on the defendant’s ethnicity. More concretely, defendants from minority groups (i.e., the Arabs in this application) should be judged more leniently when the court panel comprises members of their own group. Per the authors’ assessment, the incarceration rate and prison results are substantively similar and both support the theoretical expectation. But is the effect of judicial diversity conditional on the ethnicity of the accused, or is it homogenous across ethnic cleavages? Because the 95% CIs around the estimated effects overlap, we cannot definitively answer this question. As it turns out, in one of the analyses the effect of mixed panels on judicial outcomes is not statistically different between the two ethnic groups. Since the two analyses are seemingly equivalent, which one supports the theory and which one does not? From the information provided one cannot tell.
SDIs as a practical solution
A practical solution to circumvent the CI overlap problem is to report significance of differences intervals (SDIs). Unlike the standard CI, the SDI can be used for direct comparisons. The reason for this is that SDIs are designed such that when they do not overlap the compared estimates are distinct, even if the associated CIs overlap.
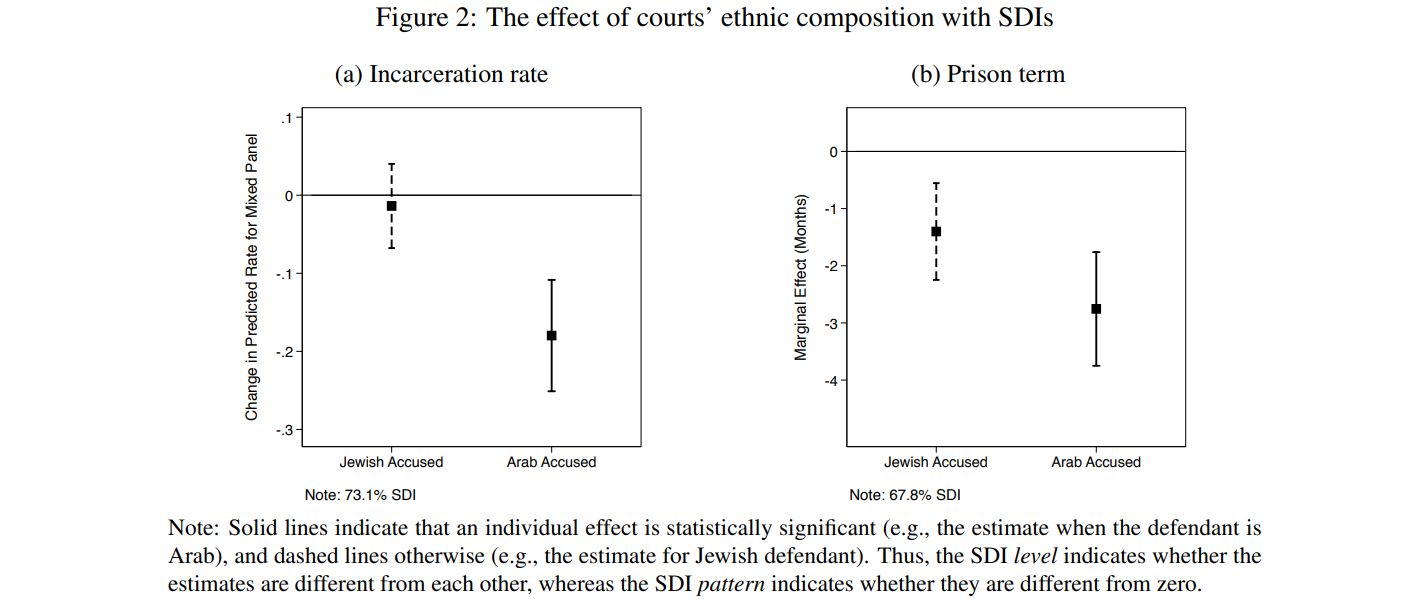
To illustrate how SDIs can be used to judge significance of differences, let us revisit the analyses on the effect of judicial diversity. As before, Figure 2a and 2b show the effect of mixed panels on judicial outcomes but with SDIs this time. Given the SDIs’ properties, significance of differences can be inferred directly from their overlap, or the lack thereof. In Figure 2a the associated SDIs do not overlap, so the estimates are statistically different. By contrast, the SDIs overlap in Figure 2b. As a result, we cannot rule out that mixed court panels impose similar prison sentences regardless of the ethnicity of the accused. This is despite the fact that only the estimate for Arab defendant is significant but not that for Jewish defendant. This suggests that the empirical support for the posited conditional relationship is not unequivocal. This finding, however, cannot be inferred from the original results (i.e., the conditional effects with their CIs).
Contribution
Radean (2023) makes several contributions. First, I derive a universal formula that can assess significance of differences from any given value, not just zero. This allows one to test whether a given effect is substantively or practically significant. Second, I expand the SDI method to accommodate comparisons between samples with an unequal number of observations (e.g., treated and untreated experimental groups, different survey waves), and between skewed distributions (e.g., the household income in the U.S., probability of civil war onset). More specifically, I introduce an original technique to compute empirical SDIs, which are derived numerically based on the estimates’ actual values or percentiles. Third, I provide an easy-to-use Stata software that automatically computes SDIs.
This blog piece is based on the forthcoming Journal of Politics article “The Significance of Differences Interval: Assessing the Statistical and Substantive Difference between Two Quantities of Interest” by Marius Radean.
The empirical analysis has been successfully replicated by the JOP and the replication files are available in the JOP Dataverse.
About the Author
Marius Radean is a Lecturer in the Department of Government at University of Essex, Wivenhoe Park, Colchester, Essex, CO4 3SQ, United Kingdom. For additional information about the sdii software (including the user’s manual as well as any future updates), visit www.mariusradean.org/software